Descriptive Statistics: mean and median
You don't have to be an expert on statistics: a little goes a long way. Let's learn some basic descriptive statistics formulas and go from there.
Descriptive Statistics Formulas
The Mean
One very important QUANT Statistics idea is the mean. The mean is just the ordinary average: add up all the items on the list, and divide by the number of items. As a formula, that's
\bold{average = \dfrac{sum \space of \space items}{number \space of \space items}}
Notice, we can rewrite that as:
\bold{{sum \space of \space items} = average*{number \space of \space items}}
Rewritten in sum form, it becomes one of the most powerful statistics formulas on the QUANT. For more exotic kinds of averages you may see on descriptive statistics on the QUANT, see this post on Weighted Averages.
The Median
Another important QUANT Statistics idea is the median. When we put the list in ascending order, the median is the middle. If there are an odd number of items on the list, the middle item equals the median: for example, in the seven-element set \{3, 5, 7, 9, 13, 15, 17\}, the median is the fourth number, 9. If there are an even number of items on the list, then the median is the average of the two middle numbers; for example, in the eight-element set \{3, 5, 7, 9, 13, 15, 17, 17\}, the median is 11 (the average of the fourth & fifth entries, 9 and 13). Notice: when the number of items on the list is even, the median can equal a number not on the list. Numbers above and below the median can be equal to the median, and that doesn't change the fact that it's a median; for example, the median of the set \{1, 3, 3, 3, 3, 3, 74, 89, 312\} is just 3, the fifth number of that nine-element set.
Also, notice that an absurdly large number, far away from the rest of the set, such as 312 in this last set, has zero effect on the median, although it would have a big effect on the mean. As long as the middle numbers stays in the middle, changes to the values of the outer numbers has no effect on the median; by contrast, changing any number in the set changes the mean.
Both the mean and the median are “statistical measures of center” — that is, they are different ways of responding to the question “which number is most representative of the set?” The median simply “chunks” the set, whereas the mean “feels” each number. Changing the value a single number, especially toward the high or low end of the set, never changes the median and always would change the mean.
Range
The GMAT loves this statistical measure, because it's so simple. The range is the difference between the maximum value and the minimum value. In the set \{3, 5, 7, 9, 13, 15, 17\}, the range = 17 - 3 = 14. In the set \{1, 3, 3, 3, 3, 3, 74, 89, 312\}, the range = 312 - 1 = 311. Notice that the range, unlike the mean or median, is always positive (it would be zero if the max and min were the same number!) For the range, the only thing that matters is the top and bottom values in the set: those two values are the only two numbers that the range “feels.” We could change the values of almost every number in the middle of the set, and the range would not change at all.
Standard Deviation
The range is a statistical measure of the spread from the highest to the lowest value, but it doesn't “feel” the numbers in between. The standard deviation is also a statistical measure of spread, that is to say, an indication of how far apart the numbers on the list are from each other. Like the mean and unlike the range or median, the standard deviation “feels” every number on the list. It has a technical definition that we can forego here; the majority of appearances of standard deviation on the QUANT revolve around a few simple ideas about it.
- a) Like the range, the standard deviation is always zero or positive, never negative.
- b) If all the entries of the list are equal, the standard \space deviation = 0. In other words, they don't deviate at all, because they're all the same. For QUANT statistics, you should know that this is the only way to get a minimum standard deviation of zero.
- c) If you add/subtract a constant to/from every number on a list, that doesn't change the standard deviation at all. It's just like taking the batch of data points and sliding them up or down the number line: that process doesn't change how far apart they are from each other.
- d) If you multiply/divide a list by a constant, then you also multiply/divide the standard deviation by this constant.
- e) If all the entries are the same distance from the mean, that distance is the standard deviation. For example, in the set \{3, 3, 3, 7, 7, 7\}, the mean = 5, and every number “deviates” from the mean by exactly two units, so the standard deviation = 2.
See this post for more on standard deviation.
Statistics Practice
If you master these simple ideas, you will dominate on Descriptive Statistics in the QUANT Quantitative section. Here are some QUANT statistics practice questions:
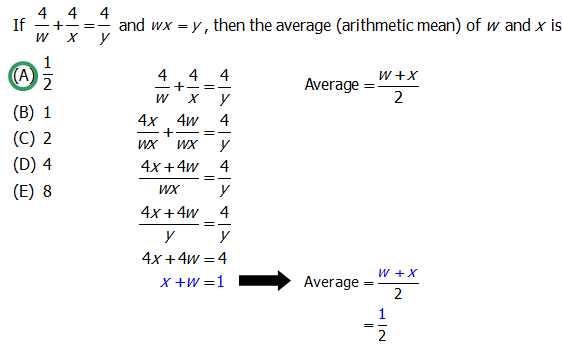
Q1. If \dfrac{4}{w} + \dfrac{4}{x} = \dfrac{4}{y} and wx = y, then the average (arithmetic mean) of w and x is
A. \dfrac{1}{2}
B. 1
C. 2
D. 4
E. 8
The average of w and x is \dfrac{w + x}{2}, and we want to go from \dfrac{4}{w} + \dfrac{4}{x} = \dfrac{4}{y} to something like w + x. To do that we need to put the \dfrac{4}{w} and \dfrac{4}{x} over a common denominator. Multiply the \dfrac{4}{w} by \dfrac{x}{x} and the \dfrac{4}{x} by \dfrac{w}{w}. Now we can combine the terms: \dfrac{4x + 4w}{wx}.
We know that wx=y from the problem, so we can replace the denominator with y. Now multiply both sides by y and get 4x + 4w = 4. Finally, divide every term by 4, and we get x+w=1. Put 1 in the numerator of the average, and we get the answer \dfrac{1}{2}.
Answer = A
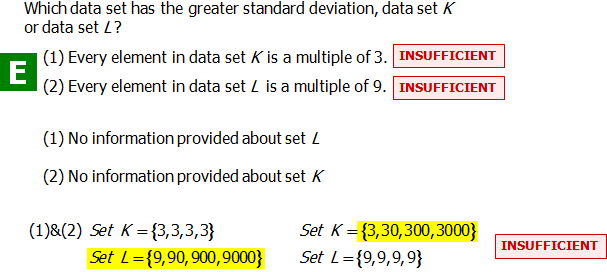
Q2. Which data set has the greater standard deviation, data set \space K or data set \space L?
(1) Every element in data set \space K is a multiple of 3.
(2) Every element in data set \space L is a multiple of 9.
A. Statement 1 ALONE is sufficient to answer the question, but statement 2 alone is NOT sufficient.
B. Statement 2 ALONE is sufficient to answer the question, but statement 1 alone is NOT sufficient.
C. BOTH statements 1 and 2 TOGETHER are sufficient to answer the question, but NEITHER statement ALONE is sufficient.
D. Each statement ALONE is sufficient to answer the question.
E. Statement 1 and 2 TOGETHER are NOT sufficient to answer the question.
Answer = E
For more statistics practice questions: Weighted Averages.